
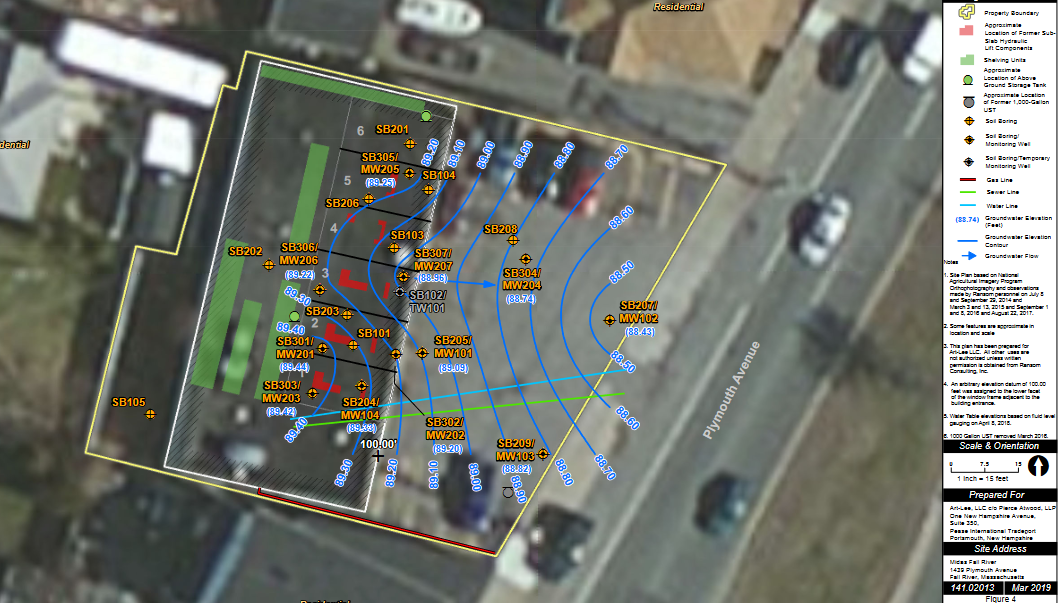
I was recently reading through Dr. Gerald Pollack’s book, The Fourth Phase of Water, and the section on exclusion zone water (named for excluding most solutes) forming around charged hydrophilic particles caught my attention. It reminded me of surprising observations I had made working at an environmental remediation site some years ago. At this site, shown in Figure 1, three or so feet of light non-aqueous phase liquid (LNAPL) oil was sitting on top of the water table in well MW104 in auto bay 1, but MW101 located just 15 feet down-gradient of this well had non-detect concentrations of dissolved petroleum compounds, which was surprising (see Table 1 for the data, and Figure 2 for a water table map). MW101 is also just 5 feet down gradient of a well, MW202 in auto bay 2, that contained half of a foot of LNAPL. Amazingly, the down-gradient groundwater was able to remain clean despite the LNAPL oil sitting on top of the water table just 5-15 feet away for several decades, as the release occurred from old hydraulic lifts in the 1970s or early 1980s.
At certain points in the site investigation, dissolved petroleum compounds in groundwater were detected in wells TW101, MW203, and MW205 within the auto bays of the building, so there must be something preventing the movement of this petroleum mass down gradient into the groundwater underneath the site parking area. Here is a link to the final report for this site for fellow environmental scientists who want to look at the details: final report.


Most petroleum-contaminated sites have a dissolved hydrocarbon phase plume stretching from the source and/or LNAPL area to dozens of feet to possibly even hundreds of feet down gradient, as shown Figure 3. The plume is especially long if the original release occurred many years ago, so why didn’t we see it at this site where the release occurred in the 1970s or early 1980s?

Obviously, the geologic materials comprising the aquifer at any given site will have a huge impact on the vertical and horizontal extent of the petroleum plume. At this particular site I am discussing, a layer of silty clay a foot or two thick right around or below the average water table depth may have facilitated the creation of exclusion zone water around the silt and clay particles, each of which carry a net negative charge (see Figure 4 and Figure 5). This silty clay layer in the sand and gravel aquifer would then keep out virtually all of the large petroleum molecules dissolved in the groundwater right below the LNAPL mass. Even though a silty clay layer may have a low hydraulic conductivity of around 10^-6 cm/sec (compared to 10^-2 to 10^-3 cm/sec for sands), after 40 or so years, groundwater with dissolved petroleum hydrocarbons should have had plenty of time to traverse a short distance of 0.5 to 1 meter through the thin silty clay layer and into the more transmissive sand and gravel layers, but at this site there are no dissolved petroleum hydrocarbons in downgradient wells in the site parking area. Most other releases happen at sites with only sand and gravel layers in the subsurface which result in long plumes of contaminants. This is possibly due to less exclusion zone water filling up the pore spaces between the sand and gravel particles, allowing for dissolved petroleum molecules to travel through the aquifer more easily and obviously due to the higher hydraulic conductivity of these materials.


The implications of the fourth phase of water discoveries may lead to new ways of remediating groundwater. New hydrophilic materials could be used for reactive barrier walls across a section of an aquifer to prevent contaminants from moving downgradient of the release area. In a future post I will build off this discussion and cover other alternative soil and groundwater remediation methods including enhanced bioremediation, mycoremediation and microbial remediation.
